
Water Losses in the Pipe: A Global Problem!
Pipes are commonly celebrated for their reliability in distributing fresh water to households, agriculture, and industry sectors. However, it’s crucial to acknowledge that a significant amount of water losses still persists in this process.
This post will be divided into several components, which are:
I. Water Losses Component
International Water Association (IWA) has established a gold standard related to the water loss component. There are two types of water losses: physical and commercial loss.
In one hand, physical loss refers to the water lost from the system due to physical flaws such as pipe breaks, leaks, and many others. Commercial loss, on the other hand, encompasses non-revenue water resulting from factors such as inaccurate metering, billing errors, or unauthorized consumption.
The difference between these 2 components also can be seen in the table 1.
| System Input Volume | Authorized Consumption | Billed Authorized Consumption | Billed Metered Consumption | Revenue Water |
| Billed Unmetered Consumption | ||||
| Unbilled Authorized Consumption | Unbilled Meter Consumption | Non – Revenue Water | ||
| Unbilled Unmetered Consumption | ||||
| Water Losses | Apparent Losses | Unauthorized Consumption | ||
| Non-Accurate Measurement | ||||
| Data Handling and Billing Errors | ||||
| Real Losses | Leakage | |||
| Utility Storage Tank |
II. Non-Revenue Water (NRW) Rates
Based on Table 1, Non-Revenue Water (NRW) is defined as the difference between the volume of water put into a water distribution system and the volume billed to customers. According to the American Water Works Association (AWWA), the NRW in a water system should not exceed 10%. However, many water utilities struggle to meet this ideal standard.
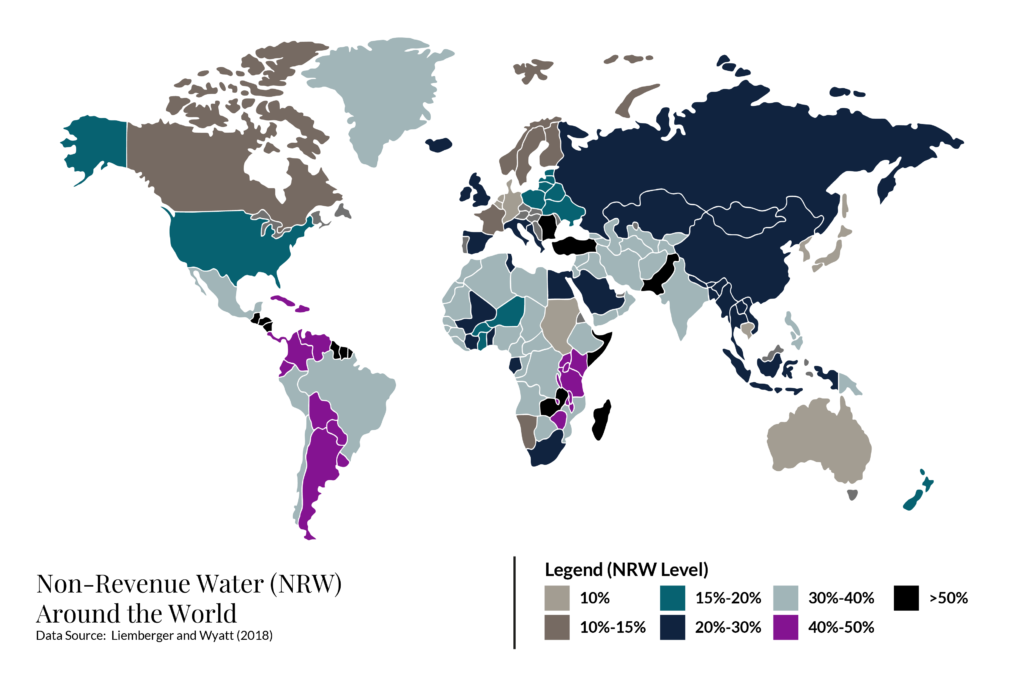
A recent study (Liemberger & Wyatt, 2018) has shown that globally, the estimated NRW volume by leakage is around 346 million cubic meters per day. World Bank (Kingdom et al., n.d.) also found that developing countries suffer the most, with a high average NRW rate above 35%, compared to developed countries with a 15% rate.
Figure 1 below illustrates how NRW rates around the world.
III. Conclusion
A high Non-Revenue Water (NRW) rate is not just a statistic; it’s a glaring indicator of shortcomings in how water utilities manage leaks and losses. It signifies a shortfall in autonomy, responsibility, technical expertise, and managerial capabilities within these utilities (Liemberger, 2010). Recent research conducted by the Asian Development Bank sheds light on the persistent challenge of reducing NRW in developing countries. Surprisingly, many water utilities struggle because they underestimate the full scope of leakage, leading to inadequate management strategies.
As the NRW issue persists, the consequences intensify. More water drains away, and the demand for water surges, propelled by population growth. Water utilities, grappling with escalating NRW losses, face constrained choices. They might opt to hike water tariffs for customers or actively seek investors to expand production and distribution capacity. Nevertheless, the fundamental non-revenue water issue remains unattended, permitting water to course through the system without accountability.
About Author
Tom, Ir. S.T., M.Sc., IPP.
